Grafana 시작
환경
Grafana
| Operating System | Ubuntu 24.04.2 LTS |
| Kernel | Linux 6.11.0-29-generic |
| Architecture | x86-64 |
| Firmware Version | 5.26 |
Prometheus
| Operating System | Debian GNU/Linux 12 (bookworm) |
| Kernel | Linux 6.1.0-28-amd64 |
| Architecture | x86-64 |
| Firmware Version | 5.6.5 |
설치
Grafana
공식 문서의 데비안 계열 패키지 매니저 설치를 그대로 따라했다.
1
sudo apt install -y apt-transport-https software-properties-common wget
1
2
sudo mkdir -p /etc/apt/keyrings/
wget -q -O - https://apt.grafana.com/gpg.key | gpg --dearmor | sudo tee /etc/apt/keyrings/grafana.gpg > /dev/null
1
echo "deb [signed-by=/etc/apt/keyrings/grafana.gpg] https://apt.grafana.com stable main" | sudo tee -a /etc/apt/sources.list.d/grafana.list
1
sudo apt update && sudo apt install grafana -y
설치가 완료되면 서비스를 시작한다. 단, 3000번 포트를 누군가 이미 점유하고 있으면 실행에 실패한다.
/etc/grafana/grafana.ini 파일을 수정하여 포트를 변경하면 된다.
(세미콜론을 떼서 주석을 해제한 후에 원하는 값으로 변경하면 된다.)
1
2
sudo systemctl start grafana-server
sudo systemctl enable grafana-server
정상적으로 실행되었다면 http://localhost:3000/login 에 접속이 가능해지고 Grafana 로그인 창이 뜬다.
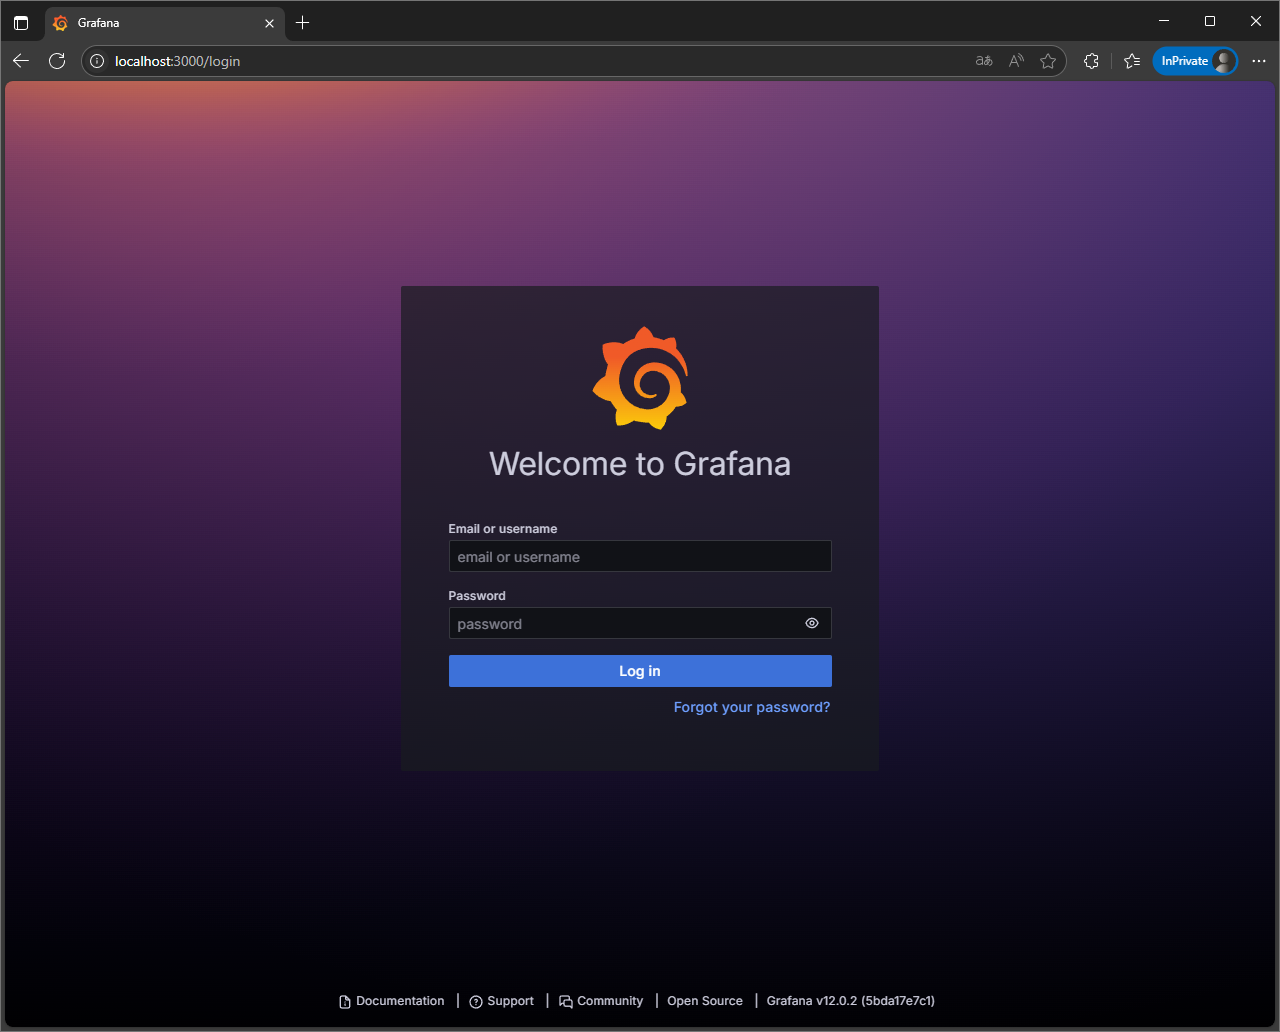
| username | password |
|---|---|
| admin | admin |
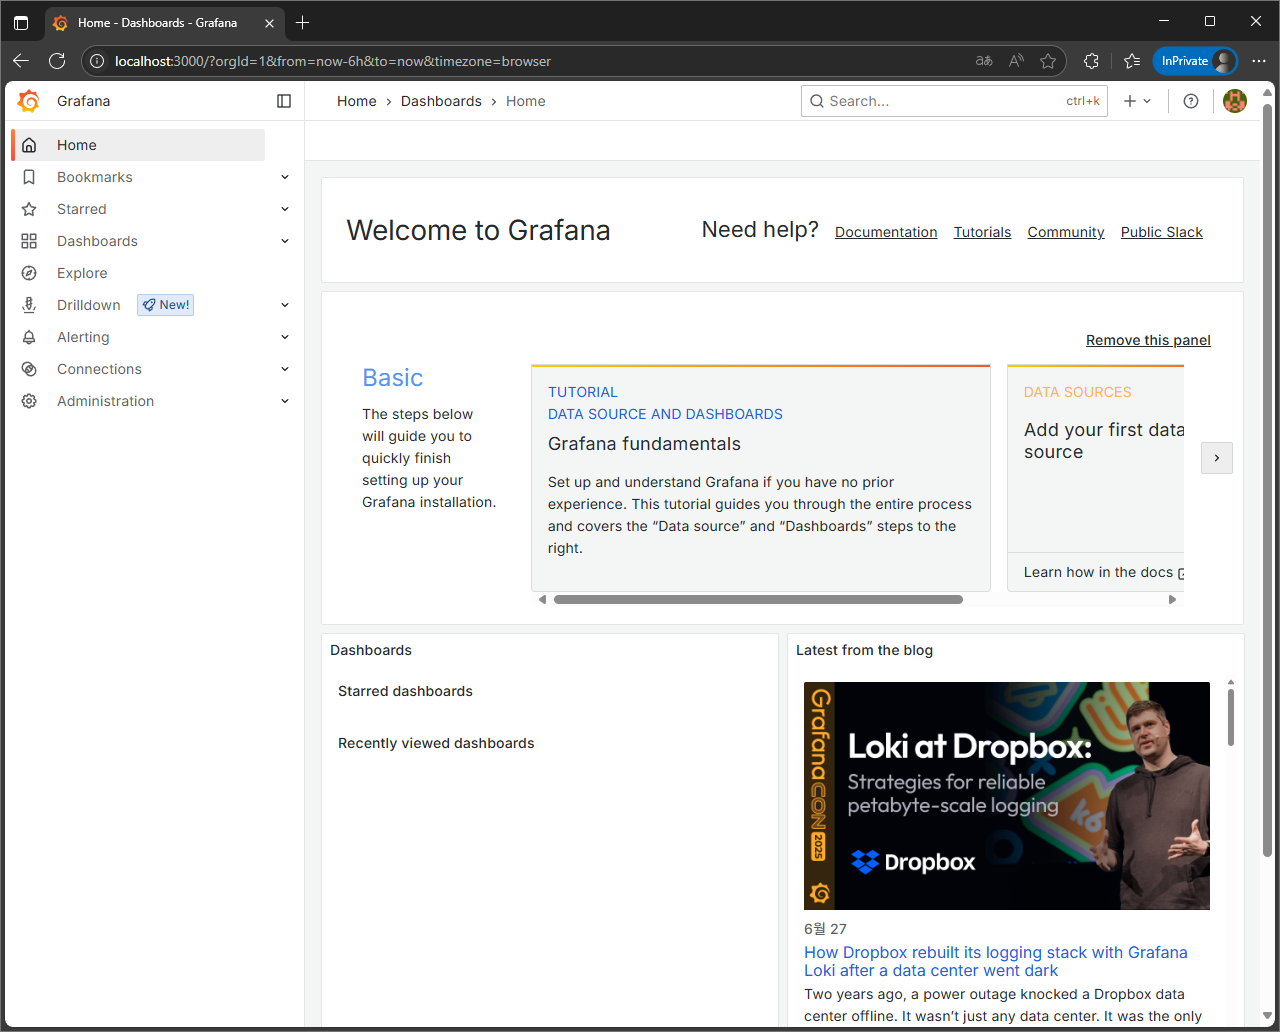
오른쪽 위에 프로필 아이콘을 선택하여 한국어와 테마를 지정할 수 있다. 기본 설정이 끔찍한 다크 모드라서 바로 변경했다.
한국어: Profile → Preferences → Language → 한국어
데마: Change theme → System preference
Data Source
다양한 데이터 소스를 Grafana에 연결할 수 있다. Grafana와 짝꿍이라고 할 수 있는 메트릭 수집기 Prometheus로 테스트를 진행했다.
Prometheus는 Node Exporter에게 주기적으로 HTTP 요청을 보내고, Node Exporter는 HTTP 포트를 열고 대기하다가 요청이 오면 그 시점의 메트릭을 수집하여 응답한다. 최종적으로 Prometheus는 자체 파일 기반 데이터베이스에 메트릭을 저장하고, 나중에 Grafana가 요청하면 시계열 데이터를 넘겨준다. Grafana는 그 데이터를 시각화하는 도구다.
Node Exporter
Node Exporter를 다운로드한다. 보면 알겠지만 많은 Exporter를 제공하고 있다. Exporter는 메트릭 수집기이므로 메트릭 정보를 수집하는 목적으로 필요하다면 사용할 수 있다.
1
tar xvfz node_exporter-*-amd64.tar.gz
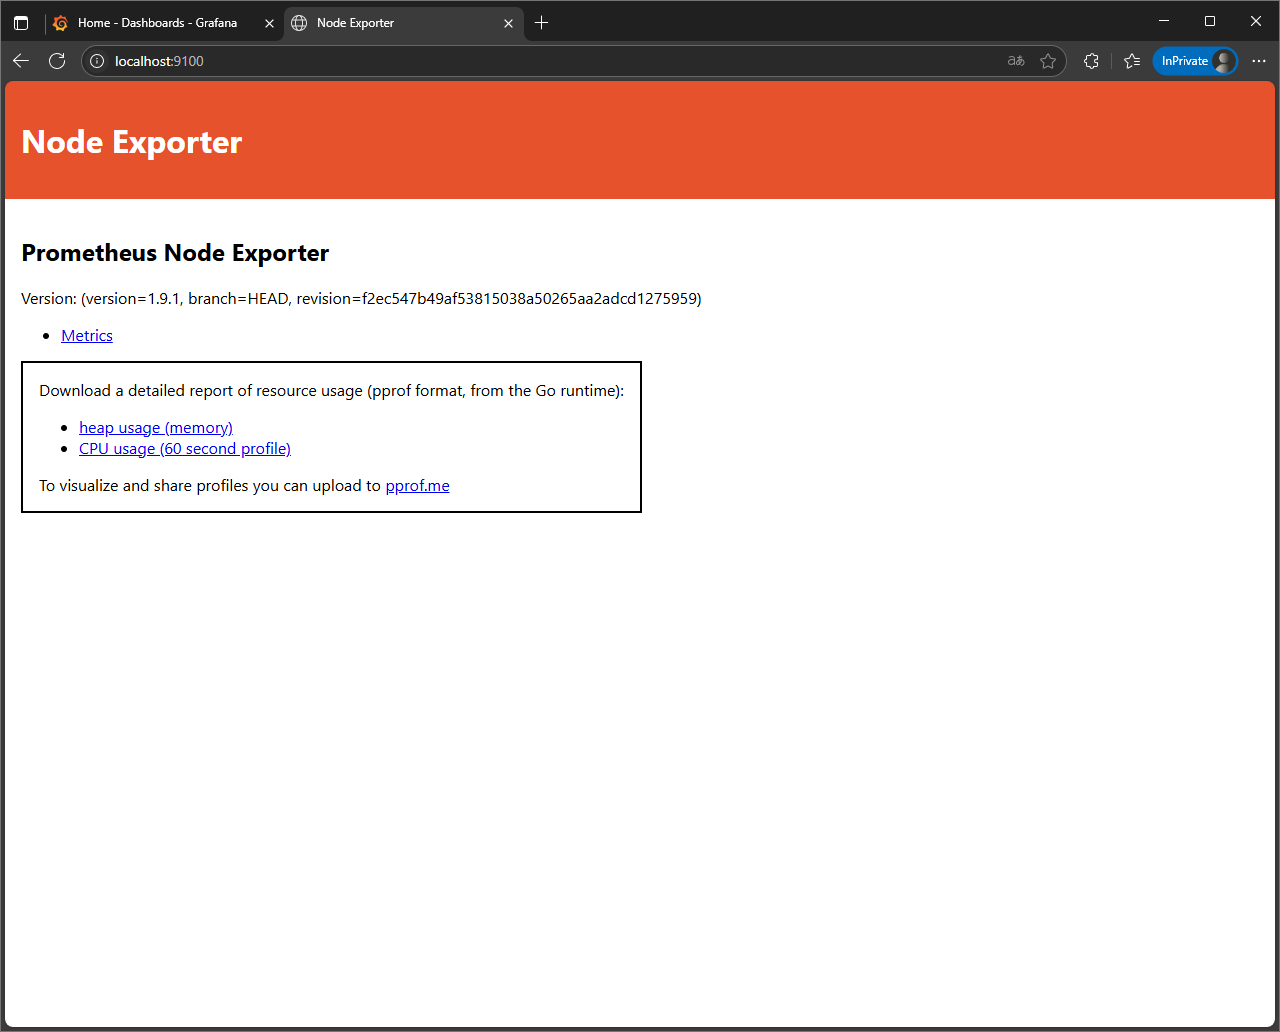
압축 해제 후 정상 실행을 확인한다. http://localhost:9100/에 접근이 가능해야 한다.
1
2
cd node_exporter-*-amd64
./node_exporter
정상적으로 실행된다면 빠져나와서 백그라운드에 올려놓는다. 임시로 올려 놓기에는 nohup이 편리하고, 장기적으로 운영하기에는 Systemd에 등록하는 것이 좋다.
nohup
1
nohup ./node_exporter &
Systemd
1
2
3
4
sudo useradd --no-create-home --shell /usr/sbin/nologin node_exporter

sudo mv node_exporter /usr/local/bin/node_exporter
sudo chown node_exporter:node_exporter /usr/local/bin/node_exporter
/etc/systemd/system/node_exporter.service
1
2
3
4
5
6
7
8
9
10
11
[Unit]
Description=Node Exporter
After=network.target

[Service]
User=node_exporter
ExecStart=/usr/local/bin/node_exporter
Restart=always

[Install]
WantedBy=multi-user.target
1
2
sudo systemctl start node_exporter
sudo systemctl enable node_exporter
Prometheus
Prometheus를 다운로드한다.
1
tar xvfz prometheus-*-amd64.tar.gz
압축 해제 후 정상 실행을 확인한다. http://localhost:9090/에 접근이 가능해야 한다.
1
2
cd prometheus-*-amd64
./prometheus
정상적으로 실행된다면 빠져나와서 prometheus.yml파일을 수정한다. node라는 job_name을 추가하고 targets에 먼저 올려놓은 Node Exporter의 주소를 넣으면 된다.
1
2
3
4
5
6
7
8
9
10
scrape_configs:
  - job_name: "prometheus"

    static_configs:
      - targets: ["localhost:9090"]

  - job_name: "node"

    static_configs:
      - targets: ["localhost:9100"]
그리고 백그라운드에 올리면 된다. 역시 nohup이나 Systemd 중 선택하면 된다.
nohup
1
nohup ./prometheus &
Systemd
1
2
3
4
5
6
7
8
9
10
11
sudo useradd --no-create-home --shell /usr/sbin/nologin prometheus

sudo mv prometheus promtool /usr/local/bin/
sudo chown prometheus:prometheus /usr/local/bin/prometheus /usr/local/bin/promtool

sudo mkdir /etc/prometheus
sudo mv prometheus.yml /etc/prometheus/
sudo chown -R prometheus:prometheus /etc/prometheus

sudo mkdir /var/lib/prometheus
sudo chown -R prometheus:prometheus /var/lib/prometheus
/etc/systemd/system/prometheus.service
1
2
3
4
5
6
7
8
9
10
11
12
13
[Unit]
Description=Prometheus
After=network.target

[Service]
User=prometheus
ExecStart=/usr/local/bin/prometheus \
  --config.file=/etc/prometheus/prometheus.yml \
  --storage.tsdb.path=/var/lib/prometheus
Restart=always

[Install]
WantedBy=multi-user.target
1
2
sudo systemctl start prometheus
sudo systemctl enable prometheus
대시보드
Prometheus가 Grafana에게 수집한 메트릭을 제공할 수 있으므로, 이제 Grafana에서 대시보드를 만들 수 있다.
Data Source 등록
- 좌측 사이드바 → 연결 → 새 연결 추가 → 데이터 소스 → Prometheus →
Add new data source Connection에 Prometheus의 주소를 입력한다.Save & test
대시보드 생성
좌측 사이드바 → 대시보드 → 신규 → 새 대시보드 로 자유롭게 대시보드를 만들 수 있다.
만약 익숙하지 않다면 다른 사람이 이미 만들어놓은 대시보드를 가져와서 볼 수도 있다.
좌측 사이드바 → 대시보드 → 신규 → 가져오기
Grafana dashboards에 공개된 대시보드가 있다. Node Exporter에 대한 대시보드는 Node Exporter Full 이런 게 있는데, 이런 대시보드의 ID를 찾아서 그것만 입력하면 가져와진다.
마지막으로 Data Source에 등록한 Prometheus를 선택하면 대시보드가 나온다.
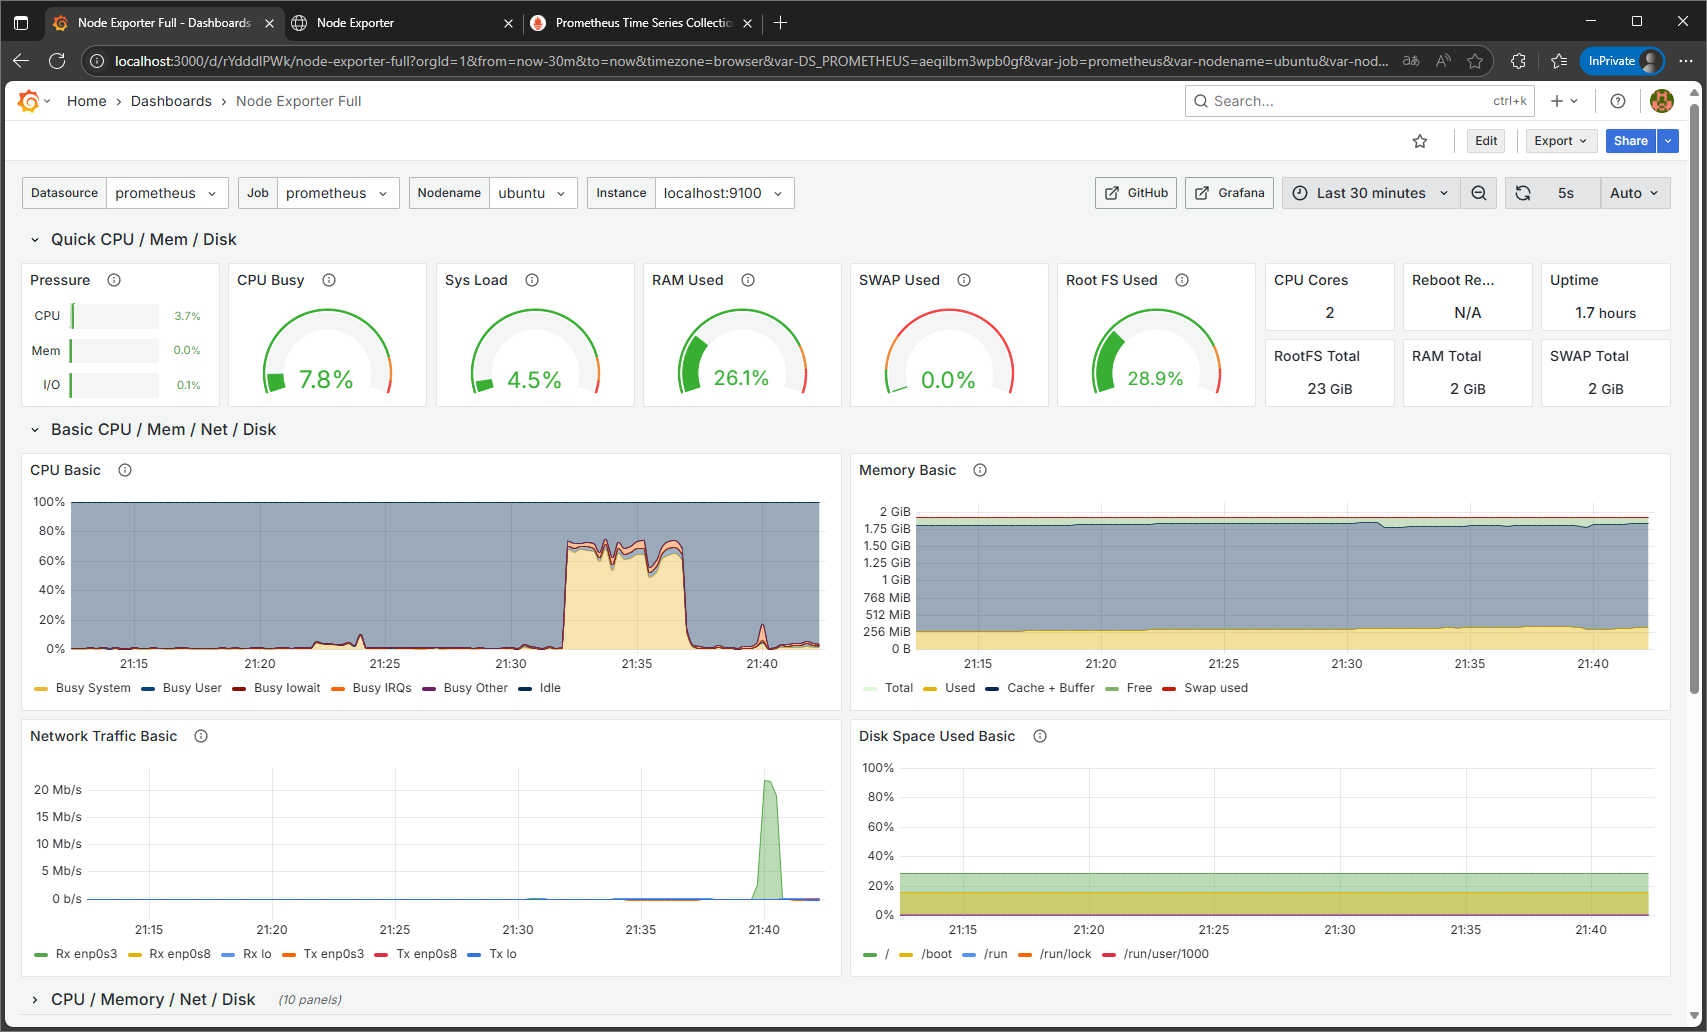
많은 시각화가 이미 되어 있으므로 이것저것 가져와서 요구사항에 맞게 수정해서 사용해도 된다.
참고
참고
- Grafana Labs
- Grafana documentation
- Get started with Grafana Open Source
- Set up
- Install Grafana
- Configure Grafana
- Start Grafana
- Sign in to Grafana
- Grafana documentation
- Prometheus
- Docs
- Prometheus Server
- Guides
</div>
- Docs
</details>